Sneaker resale premium index (2026)
Most of the sneakers that sell best on StockX in Europe now ask less than their US retail price. 60 of the top 100 ask below retail as pulled, and 46 still do with VAT added back. For a buyer, the shop price is no longer the floor. For a reseller, a new release no longer pays by default: the premium now sits with older, scarce pairs, and asks for the same shoes have fallen 32 % since November 2024.
Data as of · Barcodes.GG (Reactive Systems SL)
- 60 of 100
- top StockX EU sellers ask below US retail as pulled (46 with VAT +16 %)
- 46.8 %
- of 37,059 priced styles ask below retail (29.4 % with VAT +16 %)
- 1.10× vs 1.61×
- median ask over retail, VAT +16 %: 2026 releases against 2020 releases
- −32 %
- StockX EU asks for the same styles since November 2024
The finding in short
The resale premium is the ask on a resale marketplace divided by the retail price. At 1.00×, the lowest ask equals retail. Below 1.00×, a buyer gets the shoe for less than the brand asked at launch. We measured it for every style in Barcodes.gg price data with a StockX EU ask and a usable US retail price, in the week to 27 October 2026.
- Over all 37,059 priced styles, 46.8 % ask below retail as pulled and 29.4 % with VAT added back.
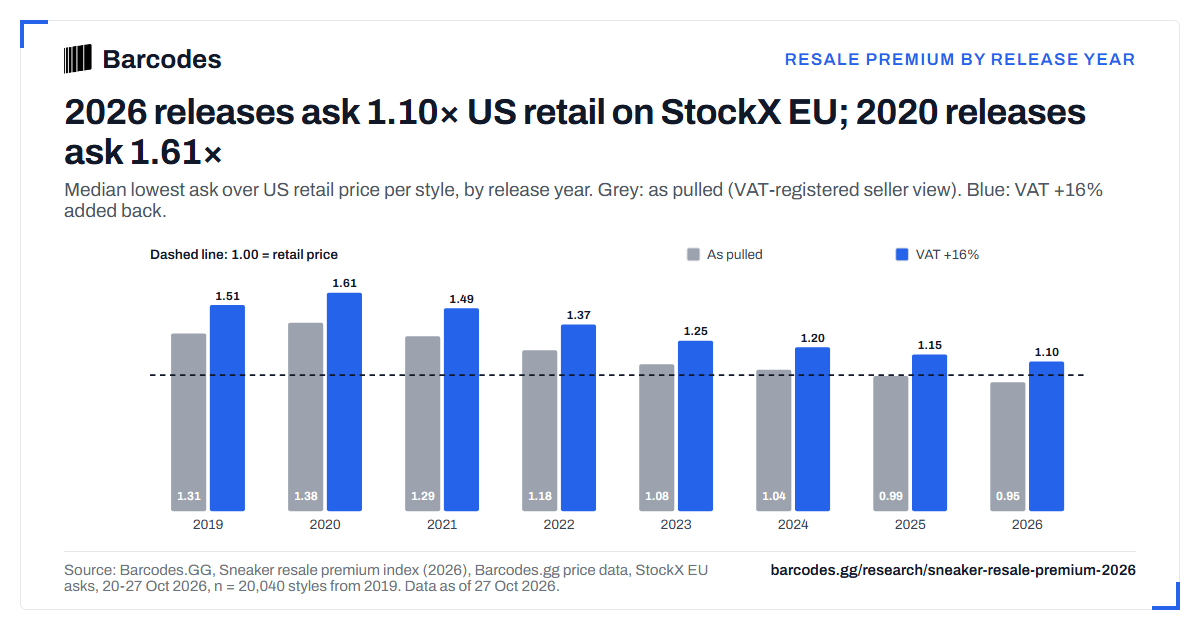
- The newer the shoe, the lower the premium: 1.10× for 2026 releases against 1.61× for 2020 releases, with VAT added back.
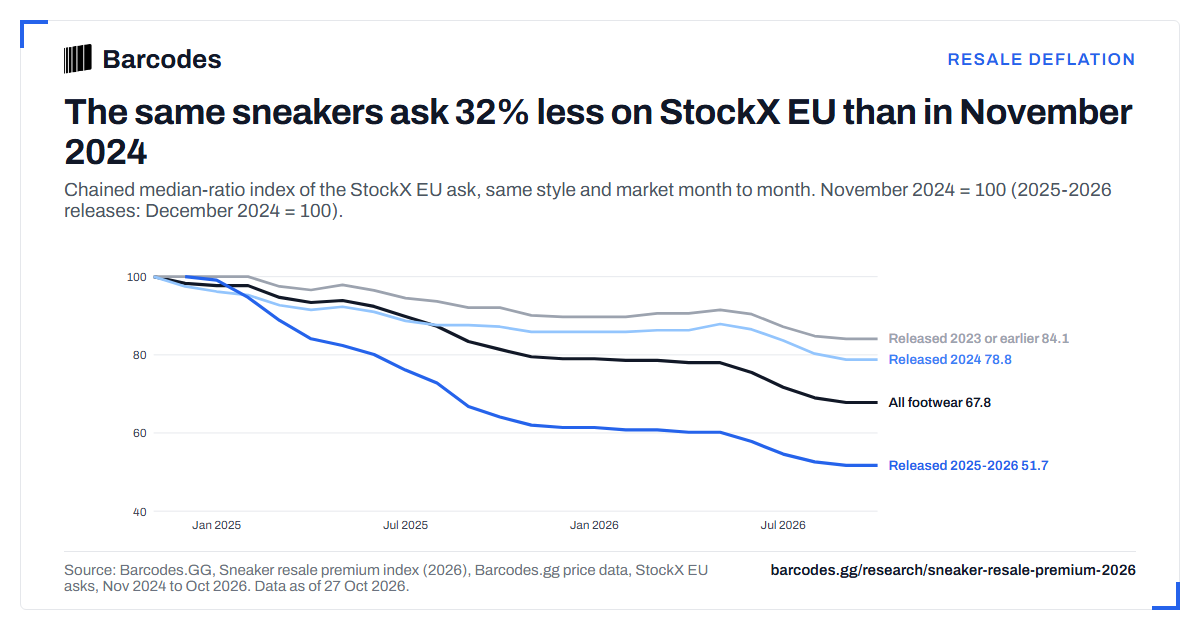
- Shoes released in 2023 or earlier ask 16 % less than in November 2024. Shoes released in 2025 or 2026 ask 48 % less than in their first month.
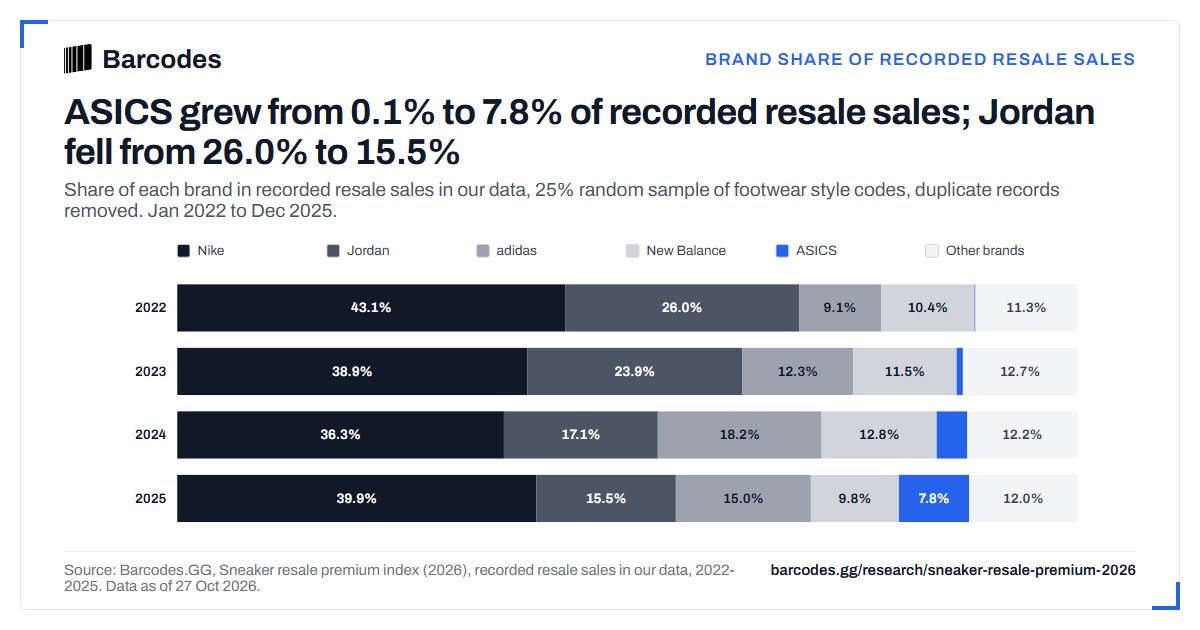
- ASICS grew from 0.1 % to 7.8 % of recorded resale sales in our data; Jordan fell from 26.0 % to 15.5 %.
The best sellers are the most likely to ask below retail
The table splits the styles by how much they sell, from all priced styles to the top 100.
| Scope | Styles | Ask / retail | Below retail | Ask / retail, VAT +16 % | Below retail, VAT +16 % |
|---|---|---|---|---|---|
| All styles with an ask and a retail price | 37,059 | 1.03× | 46.8 % | 1.19× | 29.4 % |
| Styles with a StockX sale in 30 days | 21,105 | 1.00× | 50.5 % | 1.16× | 32.9 % |
| Top 1,000 by StockX monthly sales | 1,000 | 0.93× | 57.8 % | 1.08× | 41.8 % |
| Top 100 by StockX monthly sales | 100 | 0.91× | 60.0 % | 1.05× | 46.0 % |
This looks backwards at first. A shoe that sells well should hold its price. But the styles that sell most on StockX are the ones made in the largest numbers. Thousands of sellers hold the same size, and each new sale goes to the lowest ask. Volume pushes the ask down. The top 100 styles hold 35.9 % of the StockX monthly sales of all priced styles, and their median ask is 0.91× retail as pulled, against 1.03× for all styles.
The style median also hides the sizes. In 79.7 % of the styles, at least one size asks below retail as pulled, and in the median style the most expensive size asks 2.5 times the cheapest. Our size premium study shows which sizes cost more.
What the VAT-registered view does to the asks
StockX shows a VAT-registered seller view of its EU market next to the consumer view. Barcodes.gg price data reads the VAT-registered view. For the same style, country and size, the consumer ask was a median 16 % higher over 45 styles: 16 % in Spain and 13 % in France. Without a correction, every ratio on this page would look too low by about that much. We therefore show two numbers: "as pulled" and "VAT +16 %". The second is the closer estimate of what a consumer sees before fees and shipping. Even with VAT added back, 46 of the top 100 ask below US retail.
Why 2020 releases hold value and 2026 releases do not
The table gives the median ask over retail by release year, with the share of styles below retail.
| Release year | Styles | Ask / retail | Ask / retail, VAT +16 % | Below retail | Below retail, VAT +16 % |
|---|---|---|---|---|---|
| 2019 | 311 | 1.31× | 1.51× | 24.8 % | 14.5 % |
| 2020 | 634 | 1.38× | 1.61× | 22.2 % | 13.1 % |
| 2021 | 1,165 | 1.29× | 1.49× | 26.9 % | 14.7 % |
| 2022 | 1,627 | 1.18× | 1.37× | 32.8 % | 19.9 % |
| 2023 | 2,549 | 1.08× | 1.25× | 41.0 % | 24.2 % |
| 2024 | 4,277 | 1.04× | 1.20× | 45.9 % | 28.4 % |
| 2025 | 6,034 | 0.99× | 1.15× | 50.8 % | 32.6 % |
| 2026 | 3,443 | 0.95× | 1.10× | 57.2 % | 36.2 % |
The premium falls with every year of release, from 1.61× for 2020 to 1.10× for 2026 (VAT +16 %). Three forces drive it. First, supply shrinks with age: pairs get worn, boxes get lost, and an unworn 2020 pair gets rare. Second, a 2026 release still competes with the shop. Retailers stock it, outlets discount it, and resellers who bought at launch sell at the same time to free their cash. Third, the old styles that still have an ask are the ones that people still want. A 2020 shoe that nobody wants drops off the market, so the old years show the survivors. Part of the 2020 premium is this survivor effect, not a gain in value.
Premium by brand and by model
The first table shows the brands with 300 priced styles or more; b1_premium_by_brand.csv goes down to 30 styles.
| Brand | Styles | Ask / retail | Ask / retail, VAT +16 % | Below retail, VAT +16 % |
|---|---|---|---|---|
| Nike | 10,883 | 0.98× | 1.14× | 34.3 % |
| adidas | 9,292 | 1.00× | 1.16× | 31.7 % |
| New Balance | 2,646 | 1.05× | 1.22× | 26.5 % |
| Jordan | 2,330 | 1.00× | 1.16× | 32.9 % |
| ASICS | 1,948 | 1.04× | 1.20× | 23.2 % |
| PUMA | 1,437 | 0.96× | 1.12× | 38.1 % |
| On | 1,024 | 1.11× | 1.29× | 18.9 % |
| UGG | 750 | 1.12× | 1.30× | 15.6 % |
| HOKA | 742 | 1.23× | 1.42× | 15.8 % |
| Salomon | 652 | 0.95× | 1.10× | 39.4 % |
| Vans | 619 | 1.38× | 1.60× | 10.3 % |
| Converse | 587 | 1.18× | 1.36× | 16.9 % |
| Crocs | 519 | 1.22× | 1.42× | 8.9 % |
| Saucony | 408 | 1.20× | 1.39× | 16.9 % |
| Birkenstock | 350 | 1.03× | 1.20× | 19.1 % |
Vans (1.60×) and Converse (1.36×) ask far more over retail than Nike (1.14×) or adidas (1.16×). That is partly arithmetic: their retail prices are low, so the same markup in euros is a larger ratio. Nike, adidas and Jordan have the most general releases, and their medians sit close to retail.
The next two tables show the ten highest and ten lowest model families among the 50 families with the most StockX sales (10 styles or more).
| Model family | Styles | Ask / retail | Ask / retail, VAT +16 % | Below retail, VAT +16 % | Share of StockX sales |
|---|---|---|---|---|---|
| Nike SB Dunk | 148 | 1.56× | 1.81× | 6.8 % | 1.5 % |
| Vans Old Skool | 150 | 1.39× | 1.61× | 6.7 % | 1.4 % |
| Vans Authentic | 141 | 1.37× | 1.59× | 10.6 % | 0.2 % |
| Jordan 5 | 44 | 1.28× | 1.49× | 18.2 % | 3.5 % |
| Jordan 11 | 52 | 1.27× | 1.47× | 17.3 % | 1.9 % |
| Converse Chuck Taylor | 321 | 1.23× | 1.42× | 13.7 % | 0.5 % |
| Crocs Classic Clog | 282 | 1.22× | 1.41× | 9.2 % | 0.7 % |
| Nike Blazer | 204 | 1.21× | 1.41× | 15.2 % | 0.5 % |
| Jordan 12 | 22 | 1.21× | 1.40× | 13.6 % | 1.2 % |
| New Balance 990 | 93 | 1.17× | 1.36× | 8.6 % | 0.3 % |
| Model family | Styles | Ask / retail | Ask / retail, VAT +16 % | Below retail, VAT +16 % | Share of StockX sales |
|---|---|---|---|---|---|
| Nike Shox | 233 | 0.76× | 0.88× | 71.7 % | 0.7 % |
| Nike Mercurial | 406 | 0.83× | 0.96× | 53.2 % | 0.3 % |
| Nike Vomero | 353 | 0.83× | 0.96× | 56.7 % | 2.2 % |
| New Balance 1906 | 166 | 0.85× | 0.98× | 54.8 % | 0.8 % |
| adidas F50 | 303 | 0.85× | 0.98× | 53.8 % | 0.2 % |
| Jordan 4 | 195 | 0.85× | 0.99× | 51.3 % | 8.8 % |
| Jordan Spizike | 79 | 0.86× | 1.00× | 50.6 % | 0.2 % |
| Nike Pegasus | 421 | 0.87× | 1.01× | 48.5 % | 0.6 % |
| Nike Phantom | 384 | 0.90× | 1.04× | 45.6 % | 0.4 % |
| Nike P-6000 | 164 | 0.91× | 1.05× | 43.3 % | 1.0 % |
The split follows the size of a release. The Nike SB Dunk comes out in small runs through skate shops and asks 1.81× retail. The Jordan 4 is the most-sold family, with 8.8 % of StockX sales, and asks 0.99×: its many general releases keep supply high. Running and football models such as the Vomero, Pegasus and Mercurial are easy to buy in shops, so their resale asks stay low.
Resale deflation since November 2024
The table follows the same styles from month to month as an index, with November 2024 = 100.
| Group | Jan 2025 | Apr 2025 | Jul 2025 | Oct 2025 | Jan 2026 | Apr 2026 | Jul 2026 | Oct 2026 |
|---|---|---|---|---|---|---|---|---|
| All footwear | 97.7 | 93.4 | 89.8 | 81.4 | 79.0 | 78.0 | 71.7 | 67.8 |
| Released 2023 or earlier | 100.0 | 96.6 | 94.5 | 92.1 | 89.7 | 90.6 | 87.2 | 84.1 |
| Released 2024 | 96.2 | 91.5 | 88.7 | 87.2 | 85.9 | 86.3 | 83.7 | 78.8 |
| Released 2025 or 2026 | 99.1 | 84.1 | 76.1 | 64.1 | 61.4 | 60.2 | 54.6 | 51.7 |
| Nike | 96.6 | 91.5 | 88.0 | 80.9 | 79.3 | 77.7 | 74.4 | 71.0 |
| Jordan | 99.1 | 97.5 | 94.6 | 81.1 | 79.5 | 78.4 | 74.2 | 71.2 |
| adidas | 95.6 | 91.0 | 87.1 | 76.4 | 72.8 | 72.0 | 64.4 | 60.9 |
| New Balance | 98.8 | 94.8 | 91.4 | 85.3 | 84.6 | 85.4 | 75.5 | 70.2 |
| ASICS | 100.6 | 91.5 | 88.8 | 82.8 | 79.9 | 78.7 | 71.9 | 68.1 |
Over all footwear, asks fell 32 % in two years. Part of the fall is age, because a new shoe asks most in its first weeks. The cohorts separate the two effects. Shoes from 2023 or earlier were past their launch in 2024, and they still fell 16 %: that is the market. Shoes released in 2025 or 2026 lost 48 % from their first month: that is the market plus the launch decay. Of the five brands in the table, adidas fell most (index 60.9), Nike and Jordan least (71.0 and 71.2).
Why ASICS rose while Jordan fell
The table gives the share of each brand in recorded resale sales in our data, per year.
| Brand | 2022 | 2023 | 2024 | 2025 |
|---|---|---|---|---|
| Nike | 43.1 % | 38.9 % | 36.3 % | 39.9 % |
| Jordan | 26.0 % | 23.9 % | 17.1 % | 15.5 % |
| adidas | 9.1 % | 12.3 % | 18.2 % | 15.0 % |
| New Balance | 10.4 % | 11.5 % | 12.8 % | 9.8 % |
| ASICS | 0.1 % | 0.7 % | 3.4 % | 7.8 % |
| Yeezy | 5.5 % | 5.4 % | 3.8 % | 3.1 % |
| UGG | 0.5 % | 1.9 % | 1.8 % | 2.6 % |
| PUMA | 0.5 % | 0.5 % | 1.1 % | 2.0 % |
ASICS went from 0.1 % to 7.8 % in three years. Jordan fell from 26.0 % to 15.5 %, and Yeezy from 5.5 % to 3.1 %. adidas peaked at 18.2 % in 2024. Our reading: resellers follow the premium. Retro running shoes from ASICS became street wear, with collaborations that sell out, so they began to pay. Jordan released more pairs per colourway, and its premium fell (the Jordan 4 asks 0.99× retail), so fewer resellers buy Jordans to resell. The adidas peak follows the Samba and Gazelle wave of 2024. The data shows the shift; the reasons are our interpretation.
What this means for you
If you buy: for a general release from 2025 or 2026, check StockX before you pay the shop price. 50.8 % of the 2025 styles and 57.2 % of the 2026 styles ask below retail as pulled. Compare the price for your size, not the style price.
If you sell: a launch price does not hold. The 2025 and 2026 cohort lost 48 % of its first-month ask. Sell early, or buy limited runs and older pairs, where the premium still exists. Price per size: the sneaker price API returns asks and bids per size.
Caveats in plain words
- An ask is an offer to sell, not a sale. A pair can sell lower, or not at all.
- We compare a European ask with a US retail price. US retail excludes sales tax, and the European shop price in euros is often the same number as the dollar price, so the true share below retail in Europe is probably higher.
- A catalogue retail price can be wrong or out of date.
- The VAT +16 % figure is an estimate from 45 styles.
- The index follows the styles in our price cache, and that set changes every month.
- The brand shares describe a sample of recorded sales, not the whole market.
Method
Prices. The newest StockX snapshot per style code in Barcodes.gg price data between 20 October and 27 October 2026, in EUR, without Flex asks: 45,878 style codes, 37,986 with an ask in 4 sizes or more. The style ask is the median of the lowest asks over its sizes. EUR became USD at 1.1207 (mean ECB reference rate, 20 to 26 October 2026).
VAT. The StockX asks in this study come from a VAT-registered seller view of the StockX EU market (market code ES.vat-registered). Such an ask can sit below the price that a consumer sees. For 45 styles, we compared both views for the same style, country and size over 120 days. The consumer ask was a median 1.16× the VAT-registered ask, or about 16 % higher. Ratios of an ask to a retail price therefore have two forms: "as pulled" (the VAT-registered ask) and "VAT +16 %" (the same ask with 16 % added back).
Retail. The catalogue retail price, read as US dollars only when it is a plain number or a dollar form ($N, US$N or N USD) from 10 to 2,000; 37,059 styles had both. The sales rank uses the StockX monthly sales count over the sizes of a style. The release year is the first four digits of the release date.
Index. Each month, the ask of each style is compared with its ask in the month before, same style and market. The index chains the monthly median ratios. Styles per month: 1,174 to 41,407. A brand month with fewer than 30 pairs carries the index forward and is flagged in the file.
Sales shares. A random 25 % of the footwear style codes (132,525 codes, 10,466 with a recorded sale), duplicate records removed, January 2022 to December 2025. The total level follows how many records we collected, so only the shares inside a year are shown.
Downloads
Each file holds medians, shares or indexes only. No file holds a single price, a barcode or personal data. Free for editorial use with a link to Barcodes.GG.
- b1_premium_overall.csv: Ask to retail ratio by scope (all styles, styles sold in 30 days, top 1,000, top 100)
- b3_premium_by_release_year.csv: Ask to retail ratio by release year
- b1_premium_by_brand.csv: Ask to retail ratio by brand (30 styles or more)
- b2_premium_model_extremes.csv: The ten highest and ten lowest model families by ask to retail ratio
- g4_price_facts.csv: Size-level facts on asks below retail
- e1_monthly_ask_index_by_brand.csv: Monthly ask index (November 2024 = 100) by release cohort and brand
- e1_styles_per_month.csv: Style codes in the ask index per month
- e3_brand_share_by_year.csv: Brand share of recorded resale sales, 2022 to 2025
- e3_method_facts.csv: Sample size of the sales-share table
- d3_vat_registered_check.csv: Consumer ask over VAT-registered ask, same style and size
- method_facts.csv: Method facts: windows, thresholds and sample sizes
- chart-premium-by-release-year.png: chart, median StockX EU ask over US retail by release year (1200 × 630 PNG)
- chart-ask-index.png: chart, ask index of StockX EU asks since November 2024 by release cohort (1200 × 630 PNG)
- chart-brand-share.png: chart, brand share of recorded resale sales, 2022 to 2025 (1200 × 630 PNG)
How to cite
Barcodes.GG (Reactive Systems SL). Sneaker resale premium index (2026). Data as of 27 October 2026. https://barcodes.gg/research/sneaker-resale-premium-2026
Free for editorial use with a link to Barcodes.GG. Please link this page, not a tool page, so readers can find the method and the files.
Cited by
No article has cited this study yet. If you use a figure, write to mail@barcodes.gg and we will list your article here.
Free for editorial use with a link to Barcodes.GG.
Frequently asked questions
Is an ask the same as a sale price?
No. An ask is the lowest offer to sell at that moment. A sale can happen at the ask, at a bid, or not at all.